Implementing intensive control of blood glucose concentration and blood pressure in type 2 diabetes in England: cost analysis (UKPDS 63)
BMJ 2002; 325 doi: https://doi.org/10.1136/bmj.325.7369.860 (Published 19 October 2002) Cite this as: BMJ 2002;325:860
- Alastair Gray, director (alastair.gray{at}ihs.ox.ac.uk)a,
- Philip Clarke, research fellowa,
- Andrew Farmer, NHSE R&D clinical scientistb,
- Rury Holman, directorc on behalf of the United Kingdom Prospective Diabetes Study (UKPDS) Group
- aHealth Economics Research Centre, Department of Public Health, University of Oxford, Institute of Health Sciences, Oxford OX3 7LF
- bDepartment of Primary Health Care, University of Oxford, Institute of Health Sciences
- cDiabetes Trials Unit, Nuffield Department of Clinical Medicine, University of Oxford, Oxford OX2 6HE
- Correspondence to: A Gray
- Accepted 16 July 2002
Abstract
Objective: To estimate the incremental cost of implementing policies for intensive control of blood glucose concentration and blood pressure for all patients with type 2 diabetes in England.
Design: Extrapolation of resource use and cost data derived from a randomised controlled trial.
Setting: General practice, outpatient care, and inpatient care.
Population: Trial population with diagnosed type 2 diabetes in England extrapolated to the population of England.
Main outcome measures: Total costs based on use of healthcare resources including costs of management, treatment, and hospitalisation.
Results: The incremental net annual cost of implementing intensive control of blood glucose and blood pressure to all people with diagnosed type 2 diabetes in England is estimated to be £100.5m ($156m; €159m), which is equivalent to less than 1% of the proposed additional annual expenditure on the NHS in 2001-5. This estimate varied in sensitivity analyses from £67m to £121m.
Conclusions: Policies to improve control of blood glucose and blood pressure of people with type 2 diabetes are effective in reducing complications associated with the disease and are also cost effective. The total cost represents a small fraction of the NHS's spending plans.
What is already known on this topic
The United Kingdom Prospective Diabetes Study (UKPDS) has shown that policies of intensive control of blood glucose concentration and blood pressure for people with type 2 diabetes are cost effective interventions
Current levels of diabetes care in England need to be improved, but the total cost and the implications for NHS staffing are unknown
What this study adds
Implementing the main findings of the UKPDS to all people with diagnosed type 2 diabetes in England would have a net annual cost of around £100m, which equates to 1% of the planned increase in annual expenditure on the NHS over the period 2001-5
About 720 additional staff would be required to implement these control policies, especially specialist nurses and practice nurses
The advent of primary care trusts and the national service framework for diabetes should create new incentives and mechanisms to adopt these improved standards
Introduction
The United Kingdom prospective diabetes study (UKPDS) has established that a policy for intensive control of blood glucose concentration (aiming for a fasting plasma glucose concentration <6 mmol/l) is a cost effective means of increasing the time free of complications in patients with type 2 diabetes, with the cost per year free of complications less than £1200 ($1862; €1903).1 Similarly, data from the UKPDS show that tighter control of blood pressure (aiming at a blood pressure of less than 150/85 mm Hg) in hypertensive patients with type 2 diabetes has a cost effectiveness ratio of £720 per year of life gained.2 These cost effectiveness ratios compare favourably with those of many well accepted health interventions, and implementing these control policies in place of less cost effective activities is therefore likely to increase the total health benefits obtained from the current healthcare budget.
In practice, however, the decisions that health service managers are confronted with are less beguilingly simple. Adopting a new intervention requires either identifying within a fixed budget a range of other activities that are less cost effective, have similar total costs, and can realistically be halted, or funding the new intervention partly or wholly from additional resources. In either case, it is crucially important to know not only the cost effectiveness of the new intervention but also the total cost of implementing it.
Many estimates of the overall costs associated with diabetes and its complications have been published,3 but these are generally divorced from evidence on the availability, effectiveness, and cost effectiveness of interventions—a failing common to analyses of the costs of illness. Consequently they offer no guidance to decision makers interested in allocating resources to treatments, although they may have a role in allocating research expenditures. 4 5
We set out an alternative approach, using evidence from a large randomised controlled trial to estimate the total costs and potential savings in England of fully implementing two interventions that have been shown to be cost effective: intensive control of blood glucose concentrations and blood pressure in patients with type 2 diabetes. The method could also be used to assess the total cost impact of other cost effective interventions.
Methods and data
Type of analysis and perspective
The purpose of the analysis was to estimate the total incremental cost of implementing the policies of intensive control of blood glucose concentrations and blood pressure reported by the UKPDS for all patients with diagnosed type 2 diabetes in England. The perspective taken was that of the healthcare system, and only direct costs to health services were considered. These include costs of self monitoring and management—such as using test strips to measure blood glucose concentration; visits to a dietician, specialist diabetes nurse, general practitioner, or hospital clinic; drug treatment; and the costs of treating complications of diabetes in hospital and out of hospital.
Population, setting, and comparison
The UKPDS entry criteria and population have been described.6 The study population consisted of 5102 patients with newly diagnosed type 2 diabetes recruited between 1977 and 1991 when aged 25-65 years, who had a fasting plasma glucose concentration >6 mmol/l on two occasions.6 To account for differences between the trial population and the general population with diagnosed type 2 diabetes in England we adjusted for duration of diabetes, age, and sex in all our analyses. Minor changes over time in diagnostic criteria for type 2 diabetes are unlikely to have affected this analysis. The ethnic composition of the UKPDS patients (82% white, 10% Asian, 8% Afro-Caribbean) was broadly in line with the report of the 1999 health survey for England on the health of minority ethnic groups, which indicated a prevalence of diabetes in ethnic groups of about three times that in the general population.7 We performed no additional standardisation for this.
The population of England with diagnosed type 2 diabetes has been estimated from diabetes registers, epidemiological surveys, and audits of surveys of morbidity in general practice.8–10 We used the results of the 1998 health survey for England, in which a representative sample of 15 908 adults were asked if they had ever been diagnosed by a doctor as having diabetes, as our preferred source because of its size, scope, representativeness, and general quality.11 Age and sex specific rates from this survey were then applied to the 1999 population of England. As the 1998 survey did not identify type 1 and type 2 diabetes separately, we subtracted previously published estimates of the population with type 1 diabetes from the total.12 We then estimated the proportions of patients with type 2 diabetes who have hypertension, whose glycated haemoglobin concentration is currently in the normal range, and who might be unwilling to change to an intensive regimen. Table 1 reports baseline estimates, ranges considered, and sources of data.
Ranges for variables examined in sensitivity analyses used to estimate proportions of patients with type 2 diabetes to be included in cost analysis of intensive control policies
To generalise the results obtained in a controlled trial, costs incurred by the protocol must be removed: for example, all patients participating in the UKPDS, regardless of their randomised allocation, attended clinics three or four times a year. We removed these costs and substituted the likely pattern of visits to general practitioners, nurses, and clinics required to implement UKPDS levels of intensive control of blood glucose concentrations and blood pressure. This was based on responses to a survey of the opinions of general practitioners and clinical specialists, set out in table 3 in the methods section (see our previous papers for further details 1 2). Thirty two questionnaires were distributed to the principal investigators in UKPDS centres and to general practitioners known to be familiar with the study's methods and results, and 27 were returned—a response rate of 84%.
The comparator for intensive control of blood glucose was conventional control (defined as maintenance of a plasma glucose concentration <15 mmol/l without symptoms of hyperglycaemia, primarily through diet).6 For tighter blood pressure control the comparator was less tight control (defined as aiming for a blood pressure below 180/105 mm Hg but avoiding treatment with angiotensin converting enzyme inhibitors or β blockers).17 Many patients in the UKPDS progressed to complex multiple treatments and doses reflecting modern patterns of clinical care; this was captured in our standardisation for duration of diabetes. Current guidelines recommend tighter control of blood glucose and blood pressure than was the policy in the control arms of the UKPDS, and the intensive policies of the UKPDS may now be achieved or surpassed in some diabetes services in the United Kingdom. In our sensitivity analysis we varied the proportion already treated to “intensive” standards of care.
As a proportion of people with diagnosed type 2 diabetes will already have a blood glucose concentration in the range considered normal for people without diabetes, intensive treatment will not have to be initiated. Studies from the early 1990s estimated this figure to be as low as 10%,13 but this has probably improved after payments for the management of chronic diseases were introduced for general practitioners, and the guidelines for the management of diabetes were changed after the publication of results from the UKPDS: the current estimate is that 43% of people with diagnosed type 2 diabetes are in the normal range.14 The HbA1c concentration that is considered normal has changed from 7% to 6.5%. In our baseline analysis we set the proportion already in the normal range at 25%, but we examined other proportions in a sensitivity analysis.
Resource and cost data
We took patient specific data on the incremental resources required for intensive control of blood glucose and blood pressure and the resources associated with treatment of complications from previously published trial data. 1 2 Treatment resources included doses of drugs used for treating diabetes (insulin, sulphonylureas, metformin), antihypertensive drugs (including captopril, atenolol), other drugs, blood glucose tests, self monitoring resources such as test strips, and visits to general practitioners, practice nurses, and clinics. Resources associated with complications included the number, duration, specialty of admissions to hospital, and outpatient consultations; procedures such as renal photocoagulation; and day case episodes.
We then attached the most recent available unit costs to these resource volumes. We had priced all drugs using 1999 information, and the unit costs hence reflect increases in the cost of many generic products. We costed all inpatient days, using the average of specialty based NHS financial returns from 1997-8 and 1998-9.
As the inclusion criteria for the UKPDS were patients with newly diagnosed diabetes aged 25-65 years who had not had major complications, the trial population differs from patients with type 2 diabetes in the general population. We performed indirect standardisation to adjust costs of treatment and complications to the English population and regression analyses to estimate the effects of age, sex, and duration of diabetes on costs of treatment and complications by using patient specific data for all patients in the UKPDS. The non-linear relation between hospital costs and age was represented by a modified exponential function. We then estimated the average cost for each age group standardised by sex after adjusting for the average duration of diabetes by age. Since no reliable estimates of this were available for England, we used data from the diabetes audit and research in Tayside Scotland (DARTS) database. The estimated incremental cost per person by age, sex, and duration of diabetes was then applied, and the total costs of treatment and complications for the England population were obtained by multiplying these costs per person by the number of people with type 2 diabetes in England (see table 2).
Outcomes and analysis
We performed a sensitivity analysis on several key variables that were subject to uncertainty. All results are reported as total costs in pounds at 1999 prices. We used LIMDEP version 7.0, SPSS version 10.0, and Microsoft Excel 2000 for data analysis.
Results
Population
Table 2 shows the estimated number of people in England in 1999 with a self reported diagnosis of diabetes, the number of people with type 2 diabetes, and the resulting prevalence. In total, 2.5% of the population aged 16 and over, or 1.011 million individuals, are estimated to have diagnosed type 2 diabetes and are included in this analysis.
Estimated number of people in England with diagnosis of type 2 diabetes, 199811
Costs of management and treatment
Table 3 shows the changes in annual resources per patient, compared with current practice, that are required to manage patients by controlling blood glucose and blood pressure better, based on the results of the survey of clinicians and general practitioners, and the corresponding annual cost per patient. The main contributors to total cost are visits to hospital doctors and an increased frequency of home glucose tests. Patients receiving intensive control of blood glucose and blood pressure are estimated to require three additional visits per year. The results from this survey varied between respondents from hospitals and general practitioners in a way that might be anticipated, with hospital doctors favouring a pattern of care based more on hospital care and general practitioners placing greater emphasis on general practitioner care, but the overall cost of these different patterns was almost identical.
Estimated change in resources needed to intensify control of blood glucose plus blood pressure, compared with current practice, and incremental annual costs of management per patient (£, at 1999 prices). Values are means (SDs)
Table 4 shows the incremental costs of management, treatment, and complications for the two interventions, by age. For blood glucose control, management costs constituted the major item of additional expenditure, followed by treatment costs; fewer complications related to diabetes led to cost savings that offset between 18% and 27% of these additional costs, depending on age. We assumed that patients requiring intensive control of their blood pressure would also receive intensified control of blood glucose concentrations, and so the reductions in cost associated with fewer complications would largely offset the costs of added management and treatment and, in older age groups, exceed them.
Incremental costs of policies for intensive control of blood glucose and blood pressure, per person (£, at 1999 prices)
Table 5 shows the results of applying these per person data to the estimated population with type 2 diabetes in England. The central estimate is that the additional management costs of implementing these policies would be £132m per year, plus an additional £73m in drugs and extra insulin supplies. The consequence of better control of blood glucose and blood pressure would be to reduce the costs of hospitalisation associated with treating complications by around £104m per year. Consequently, the net cost of this programme would be £100.5m per year.
Estimated total cost of adopting policies for intensive control of blood glucose and blood pressure control, England (at 1999 prices). Values are £m unless otherwise indicated
Figure 1 shows how these additional management costs would be broken down, indicating that the main elements of additional management costs would be more frequent visits to hospital clinics and more frequent home glucose testing. Implementing a policy on this scale would have far reaching staffing implications, and table 6 gives illustrative estimates, based on the number of patients staff could see in a typical session and the number of sessions that could be provided over a year. We estimate that the policy would require an additional 336 whole time equivalent specialist nurses, and also large numbers of additional general practitioners, practice nurses, and hospital based clinicians. Set against these additional staff, the number of inpatient days required for treatment of complications related to diabetes would fall by 343 000 each year, equivalent to 1100 beds if the occupancy rate is 85%.
Estimated total incremental resource impact of adopting policies for intensive control of blood glucose and blood pressure, England, 2001

Estimated additional management costs (£, at 1999 prices) of adopting policies in England for intensive control of blood glucose and blood pressure by category of resource use (total=£132m)
Figure 2 shows a sensitivity analysis reporting the impact of changes in main variables on the estimated total cost. Changes in the unit cost of home blood glucose strips, in the proportion of patients already being managed intensively, and the costs of intensifying management have the largest impact, but no change alters the total cost estimate by more than £30m upwards or downwards.
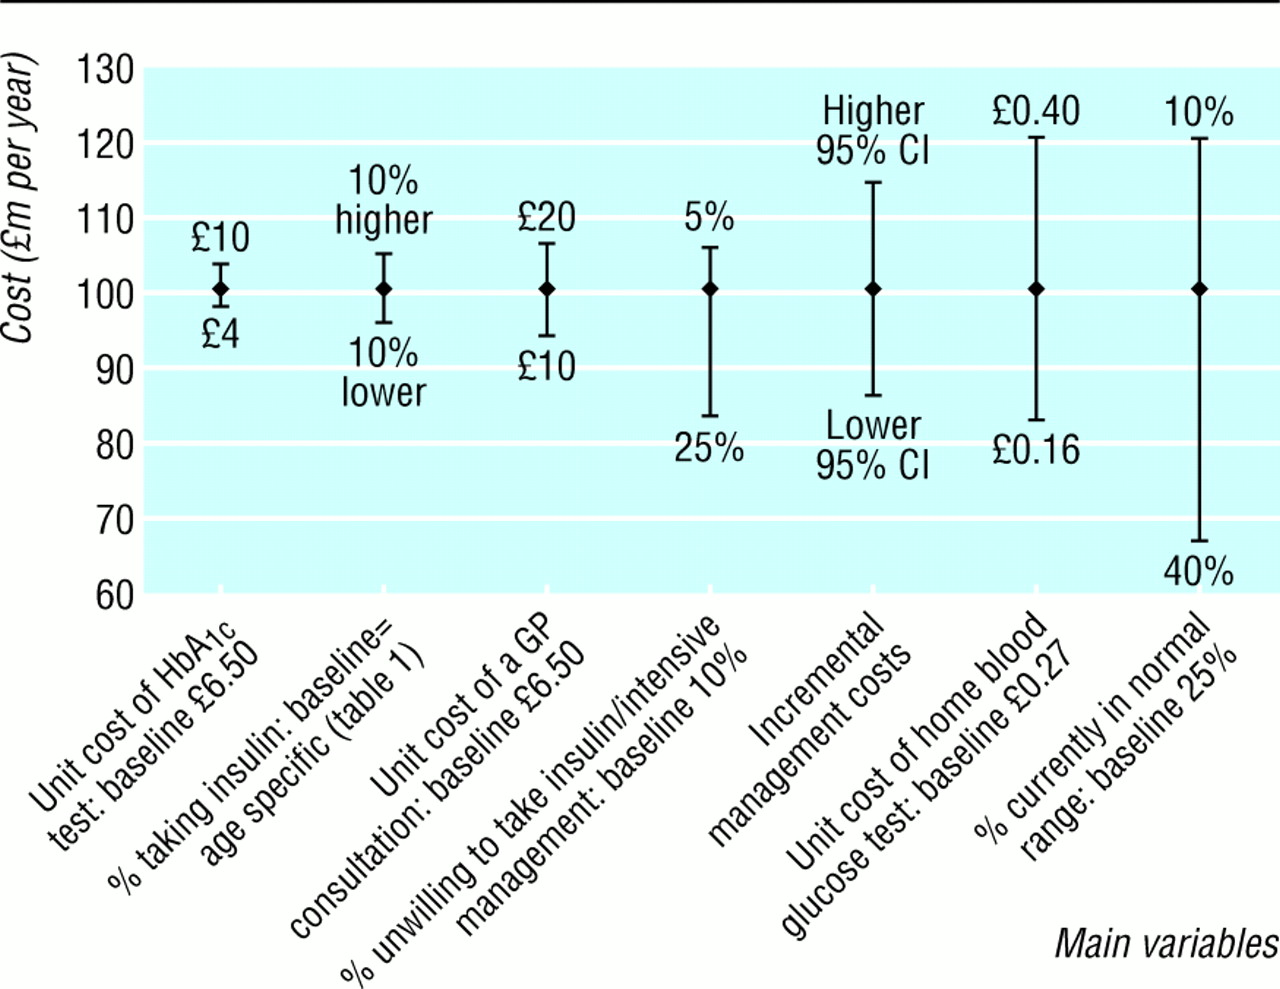
Sensitivity analysis showing impact on estimated total cost of changes in main variables, baseline total=£100.5m
Discussion
We have reported estimates of the national cost to the NHS in England of fully implementing two interventions for which good evidence exists on effectiveness and cost effectiveness—intensive control of blood glucose concentration and blood pressure for people with diagnosed type 2 diabetes. We have not considered other interventions—such as lifestyle interventions—as little evidence exists on their effectiveness and cost effectiveness.
Funding agencies often require the inclusion of economic evaluations in the randomised controlled trials they fund, and guidelines for the design, conduct, and presentation of such studies are well established. 18 19 These guidelines focus on accurate estimation of a cost effectiveness ratio, whereas the Treasury or the Department of Health will generally also be concerned with the total cost and service implications of introducing the technology. Since the opportunity cost of displacing existing technologies increases as the total cost of the new intervention rises (assuming existing services that are the least cost effective are displaced first), the cost effectiveness and total cost of a new intervention should be considered jointly. Some agencies require analysts to provide a “budget impact” for new technologies but give no details of how this should be done.19 Our study shows a method for doing so and illustrates that this is not straightforward, even when patient specific information from large trials such as the UKPDS is available.
Estimating the total costs and benefits associated with an intervention is also relevant to assessing the value of obtaining information from additional research. In that framework, information has value as it reduces the costs of uncertainty surrounding a decision, and these costs in turn depend on the size of the patient population and its capacity to benefit.20
Strengths and weaknesses of the study
The analysis presented here is concerned exclusively with the treatment of people who have diagnosed type 2 diabetes and is not concerned with screening for undiagnosed diabetes. Neither does this analysis estimate the potential impact of wider use of treatment with metformin for overweight patients with type 2 diabetes, although good trial based evidence shows that this is effective and may be cost saving. 21 22
We used self reported data from the health survey for England 1998 to estimate the total number of people with diagnosed type 2 diabetes. Self reported numbers may underestimate the true number of people with diagnosed disease, but the overall prevalence of 2.5% among people aged 16 or older is higher than the 1.5% reported from primary care audit groups or the 1.7% from record linkage data. 8 10
We incorporated only direct healthcare costs of type 2 diabetes; including the substantial costs associated with diabetes that are incurred by social services, informal carers, and patients could reduce the societal cost of implementing the programme outlined here.23
Unanswered questions
The costs identified in this study will be borne primarily by general practitioners in terms of greater numbers of visits by patients with diabetes, whereas the benefits in terms of lower complications will accrue mainly to the hospital sector. In some future well functioning model of primary care trusts buying packages of care from hospitals for their patients, this need not be a major problem. In the immediate future some of these savings could be transferred back to general practitioners by the partnership arrangements envisaged in the national service framework for diabetes.
A related issue concerns incentives in primary care to improve standards of care for people with diabetes. Existing payments for the management of chronic diseases such as diabetes may have improved standards of care when introduced, but 94% of all practices are now approved for such payments,17 and these payments are unlikely to be a vehicle for further improvement without adaptation. Incentive payments related to an appropriate measure of performance, such as a reduction in the mean blood glucose concentration of diagnosed patients in a practice or primary care trust, or to participation in diabetes related education programmes, may be worth exploring.
Economic analyses reporting cost savings from reduced bed use are sometimes criticised because savings are unlikely to be realised in practice, but such reductions provide opportunities to reduce bed numbers or use the capacity for other purposes and do represent an economic benefit. The staff resources we have estimated are strictly the incremental changes associated with improved control of blood glucose concentration and blood pressure and will not remedy the marked staffing variations and deficiencies in existing primary and secondary diabetes services that were identified in recent surveys. 24 25 Individual practices might experience difficulties in providing a practice nurse for one or two additional sessions per week, but primary care trusts should find it easier to employ additional staff and run clinics at the optimum scale in relation to patients' requirements.
Finally, the net annual cost of implementing the main findings of the UKPDS to all people with diagnosed type 2 diabetes in England as estimated in this analysis (£100.5m, with the sensitivity analysis varying from £67m to £121m) is less than 1% of the proposed increase in annual expenditure on the NHS over the period 2001-5 set out in the government's expenditure plans.26 Although many claims are made on these additional resources, it seems reasonable that one guiding principle should be to allocate funds to interventions of proved effectiveness and cost effectiveness that will benefit many people.
Acknowledgments
We thank Carol Cull and Irene Stratton for comments on the analysis and manuscript and for supplying UKPDS data; Sue Manley, David Matthews, Andrew Neil, Amanda Adler, Richard Stevens, and David Buck for comments on the manuscript; Ian Ross for information on costs of glycated haemoglobin tests; Ray Newton for providing data from the DARTS database; patients and staff at the UKPDS centres; and the clinicians and general practitioners who participated in the survey.
The participating centres for UKPDS 63 were: Radcliffe Infirmary, Oxford; Royal Infirmary, Aberdeen; General Hospital, Birmingham; St George's Hospital and Hammersmith Hospital, London; City Hospital, Belfast; North Staffordshire Royal Infirmary, Stoke-on-Trent; Royal Victoria Hospital, Belfast; St Helier Hospital, Carshalton; Whittington Hospital, London; Norfolk and Norwich Hospital; Lister Hospital, Stevenage; Ipswich Hospital; Ninewells Hospital, Dundee; Northampton Hospital; Torbay Hospital; Peterborough General Hospital; Scarborough Hospital; Derbyshire Royal Infirmary; Manchester Royal Infirmary; Hope Hospital, Salford; Leicester General Hospital; Royal Devon and Exeter Hospital.
Footnotes
-
Funding The major grants for the United Kingdom Prospective Diabetes Study were from the UK Medical Research Council, British Diabetic Association, the UK Department of Health, the National Eye Institute and the National Institute of Digestive, Diabetes, and Kidney Disease in the National Institutes of Health (United States), the British Heart Foundation, Novo-Nordisk, Bayer, Bristol Myers Squibb, Hoechst, Eli Lilly, Lipha, and Farmitalia Carlo Erba. We thank Glaxo Wellcome, SmithKline Beecham, Pfizer, Zeneca, Pharmacia Upjohn, Novo Nordisk, Bayer, Roche, and the UK Department of Health for grants for this health economics study. Other funding companies and agencies, the supervising committees, and all participating staff are listed in an earlier paper (Lancet 1998;352:837-53).
-
Competing interests Competing interests: RH has received research monies for members of staff and fees for consulting from a number of pharmaceutical companies. AG has received support for attending conferences from Lipha and GlaxoSmithKline. Reprint requests to: UKPDS Group, Diabetes Trials Unit, Oxford Centre for Diabetes, Endocrinology and Metabolism, Radcliffe Infirmary, Woodstock Road, Oxford, OX2 6HE