Education, income inequality, and mortality: a multiple regression analysis
BMJ 2002; 324 doi: https://doi.org/10.1136/bmj.324.7328.23 (Published 05 January 2002) Cite this as: BMJ 2002;324:23
- Andreas Muller, professor (axmuller{at}ualr.edu)
- Department of Health Services Administration, University of Arkansas at Little Rock, 207 Ross Hall, 2801 South University Ave, Little Rock, AR 72204, USA
- Accepted 4 October 2001
Abstract
Objective: To test whether the relation between income inequality and mortality found in US states is because of different levels of formal education.
Design: Cross sectional, multiple regression analysis.
Setting: All US states and the District of Columbia (n=51).
Data sources: US census statistics and vital statistics for the years 1989 and 1990.
Main outcome measure: Multiple regression analysis with age adjusted mortality from all causes as the dependent variable and 3 independent variables—the Gini coefficient, per capita income, and percentage of people aged ≥18 years without a high school diploma.
Results: The income inequality effect disappeared when percentage of people without a high school diploma was added to the regression models. The fit of the regression significantly improved when education was added to the model.
Conclusions: Lack of high school education accounts for the income inequality effect and is a powerful predictor of mortality variation among US states.
What is already known on this topic
What is already known on this topic Aggregate studies have shown a positive relation between income inequality and mortality and three possible explanations have been suggested (relative deprivation, absolute deprivation, and aggregation artefact)
Income inequality may reflect the effects of other socioeconomic variables that are also related to mortality
What this study adds
What this study adds Multiple regression analysis of the 50 US states and District of Columbia for 1989-90 indicates that the relation between income inequality and age adjusted mortality is due to differences in high school educational attainment: education absorbs the income inequality effect and is a more powerful predictor of variation in mortality among US states
Lack of high school education seems to affect mortality by economic resource deprivation, risk of occupational injury, and learnt risk behaviour. It may also measure the lifetime, cumulative effect of adverse socioeconomic conditions
Introduction
Several recent studies have reported a positive relation between income inequality and mortality. The association has been observed in US metropolitan areas and states and, to varying degrees, in international studies.1–3 The relation remains intact when different measures of income inequality are used. The critical question is how this relation should be interpreted.
Three competing interpretations have been advanced. Wilkinson believes that income inequality produces psychosocial stresses for individuals placed at lower ranks of the socioeconomic hierarchy.4–6 Continuous stress due to deprivation of status will lead to deteriorating health and higher mortality over time. The fact that median or per capita household income cannot account for the relation has been taken as evidence that “relative income,” or income inequality, is more important than absolute income for human health and longevity.
Gravelle argues that the correlation between income inequality and mortality may be artefactual in part.7 He shows mathematically that the aggregate relation is consistent with a negative, curvilinear relation between income and the probability of dying for individuals. Wolfson et al's clever test of Gravelle's hypothesis indicates, however, that the individual relation between income and mortality cannot fully account for the aggregate relationship.8
The “neo-material” interpretation asserts that income inequality reflects individual and community forms of absolute deprivation. Lynch et al argue that poorer individuals disproportionately experience health taxing events and lack of resources throughout their lives.9 They live in deprived communities characterised by “underinvestment” in the social and physical infrastructure. Both forms of deprivation produce cumulative wear and tear. The experience depletes health, resulting in higher mortality for those in lower socioeconomic strata. The aggregate effect is that societies with increasing income inequality will experience higher mortality than they would otherwise. Lynch et al suggest that material conditions may be sufficient in explaining the relation between income inequality and mortality.
The neo-material interpretation gives only a broad indication of which material circumstances are important. Kaplan et al's analysis of US states, however, suggests some potential answers.2 They report that income inequality is significantly correlated with certain risk factors (homicide rates and unemployment rates), social resources (food stamps and lack of health insurance), and measures of human capital (educational attainment). The substantial correlations with some measures of human capital imply that income inequality may not have a direct effect on mortality. Instead, income inequality may reflect the effects of other socioeconomic variables that are also related to mortality. Among those variables, the contribution of formal education deserves most attention since it typically precedes work and income. It is also related to mortality.
Higher educational degrees are typical prerequisites for highly compensated work in the United States and other industrialised nations. According to US census data for the year 1998, the median earnings of adult, year round workers with professional degrees are about four times higher than those of adults who had not completed high school.10 Thus, the level of education ought to be correlated with cumulative income, which is the basis for measuring income inequality.
In addition, more schooling seems to extend life.11–14 In econometric studies years of schooling typically had a stronger negative effect on age adjusted mortality than per capita income when other measures were controlled for. Therefore, the association between income inequality and mortality found in aggregate studies may be partially the result of variation in educational attainment. I tested this hypothesis using data for the US states, which have shown substantial associations between measures of income inequality measures and age adjusted mortality.
Data and methods
The study is based on a cross sectional analysis of US census statistics and vital statistics for the years 1989 and 1990 for all US states including the District of Columbia (n=51). Age adjusted mortality from all causes was the main dependent variable of the analysis.15 I used the CDC WONDER data extraction tool to standardise the age specific death rates by the direct method,15 using the US age distribution for 1990 as the standard population. The data were pooled for the years 1989 and 1990 to make death rates more reliable.
The Gini coefficient for households was the main independent variable of interest.16 This measures the difference between the areas under the curve of a graph of actual distribution of cumulative income and one indicating equality of income distribution. The Gini coefficient ranges from 0 to 1 and measures the degree of income inequality. A value of 0 indicates that each household obtains the same amount of income, while a value of 1 indicates that only one household earns all income. 17 18
To control for varying income levels among states, I included the per capita income of all people in the regression model.19 The per capita income variable was log (ln) transformed to reduce positive skew. Both income variables pertain to the calendar year 1989. I measured educational attainment by the percentage of people aged ≥18 years without a high school diploma in 1990.20
I analysed age adjusted mortality by multiple regression.21 The proportion of the population living in each state in 1990 was the weighting factor, and STATISTICA software22 estimated the regression models.
Results
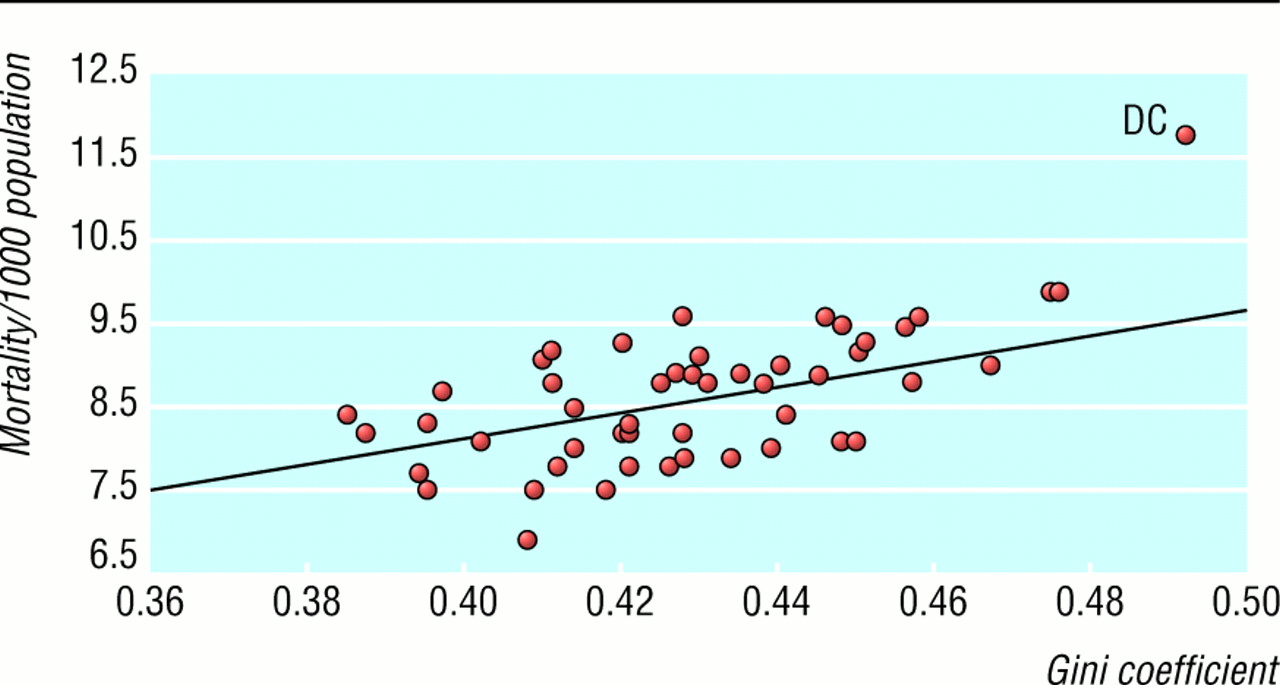
Fig 1 shows the relation between the measure of income inequality and age adjusted mortality. The scatterplot indicates a positive linear relation, with the District of Columbia being an apparent outlier. The range in income inequality between states was about 0.1. The regression coefficient indicates that a 0.1 unit increase in the Gini coefficient was associated with an increase of 1.6 deaths per 1000 population.

Age adjusted death rates by Gini coefficient for the 50 US states and the District of Columbia (DC), 1989-90 (y=1.831+15.705×x; R2=0.24; weighted regression). (Data sources US Public Health Service15 and US Census Bureau16)
Fig 2 shows a positive, linear relation between education and age adjusted mortality. The observations cluster around the regression line except for the District of Columbia. The range in the education variable was about 20 percentage points. The related increase in age adjusted mortality was about 2.1 deaths per 1000 population.

Age adjusted death rates by educational attainment for the 50 US states and the District of Columbia (DC), 1989-90 (y=6.16+0.103×x; R2=0.51; weighted regression). (Data sources US Public Health Service15 and US Census Bureau20)
Fig 3 presents the percentage of variation in age adjusted mortality explained by five regression specifications. All regression models were statistically significant at P<0.001. The two income measures accounted for 27.7% of the variation in age adjusted mortality. Lack of high school education by itself explained over half of the variation in the dependent variable. The regression coefficients for both income variables were non-significant when added to a model including the education measure: they accounted for no additional variation in the dependent variable when the education variable was controlled. The adjusted R2 values slightly decreased with the addition of the income measures, since the adjustment corrects for redundancy. Deleting the District of Columbia from the analysis improved the fit of regression specifications, including education, in the model but did not substantively change the results shown in fig 3.

Percentage of variation in age adjusted mortality explained by education and income variables for the 50 US states and District of Columbia, 1989-90
Subgroup analysis
A preliminary analysis of age specific mortality indicated that the findings might best reflect the experience of people aged ≥45 years. For the 15-44 year age group, the Gini coefficient was significant and positively related to age specific death rates, whereas the education variable was only marginally significant. Since the analysis did not restrict the age range of the independent variables to people aged 15-44, the results might be biased. Deaths for 15-44 year olds comprised 8.3% of all US deaths in 1989-90, with accidental and violent deaths among the leading causes.
The definition of the education variable excludes children. Therefore, I estimated all regressions with the dependent variable restricted to people aged ≥20 years. The results of the analysis paralleled those in fig 3, with model fit reduced by 1 to 3 percentage points.
Gini coefficients for individual states were not available by householder's race or sex. As an alternative, I included the percentage of African-American and Latino people in populations in a regression model that included education, per capita income, and the Gini coefficient. The variable measuring the effect of belonging to economically depressed minorities was significant (b=0.03; t=3.26) and reduced the direct education effect to b=0.07 (t=2.97).
I also ran the regressions for each sex. The education and income variables predicted age adjusted mortality for males better (R2adj=0.54) than for females (R2adj=0.34). However, the results of the sex specific analyses were consistent with those in fig 3.
Discussion
This study had two main findings. Income inequality, as measured by the Gini coefficient, had no unique effect on US age adjusted mortality when the level of formal education was controlled for. Educational attainment, as measured by lack of completed high school education, was a more powerful predictor of differences in mortality than income inequality in US states.
Over a decade has passed since the 1990 US census was taken. Therefore, my findings may not be applicable today. When data on income inequality and vital statistics are released for individual states for the years 1999-2000 this concern can be examined.
The potential role of education has been overlooked in previous research on income inequality and mortality, 1 2 which focused more on the potentially contaminating effects of income and poverty. In my analysis I did not directly control for poverty, but the effect of poverty was not excluded. It was indirectly reflected in the per capita income and education measures.
Implications of results
Lack of high school education completely captured the income inequality effect and income level effect in my age adjusted analysis. This finding suggests that physical and social conditions associated with low levels of education may be sufficient for interpreting the relation between income inequality and mortality. My results therefore seem to support the idea that absolute deprivation rather than relative deprivation is important for influencing mortality.
One reviewer pointed out that this view might be too narrow. The income inequality measure might also express the “burden of relative deprivation” in society, as discussed by Marmot and Wilkinson.23 Lack of high school education may indicate low status, which, by definition, implies a relative position in the social hierarchy. However, low educational status may indicate only lack of material resources and other adverse life circumstances. It remains to be seen whether low educational status produces the additional stressful, invidious hierarchical comparisons that lead to poorer health and greater mortality. Since aggregate data are not well suited for examining hypotheses at the individual level, my study cannot confirm or rule out the importance of psychosocial processes.
An expanded regression analysis (available on request) indicated that lack of high school education was related to lack of health insurance, belonging to economically depressed minority groups, working in jobs with high risk of injury, and smoking. This finding suggests that lack of material resources, occupational exposure to risk, and certain learnt health risk behaviour might be reflected in the large education-mortality effect.
Less educated people may be concentrated in areas that are more risky to life and health. Some research has suggested that these communities may lack sufficient investment in health related infrastructure such as access to health care, proper police protection, and healthy housing.24 These potential risk factors are only indirectly assessed by the variables used in my study.
Lack of high school education may also represent lifetime effects of socioeconomic deprivation. Davey Smith et al found that socioeconomic conditions during childhood adversely affected adult mortality in a large, prospective study of adult Scottish men.25 My study could not determine intergenerational effects of educational attainment. However, this path of research seems promising since considerable linkage between parents and offspring have been seen for educational attainment and for incomes in Britain26 and in the United States. 27 28 Lack of high school education may also capture the lifetime effect of adverse social conditions increasing mortality. Income inequality is only one aspect of this broader experience.
Acknowledgments
I thank Drs Wilkinson, Davey Smith, and Altman for their valuable comments on an earlier version of this paper.
Footnotes
-
Funding My study was supported by my sabbatical leave granted by the University of Arkansas at Little Rock.
-
Competing interests None declared.